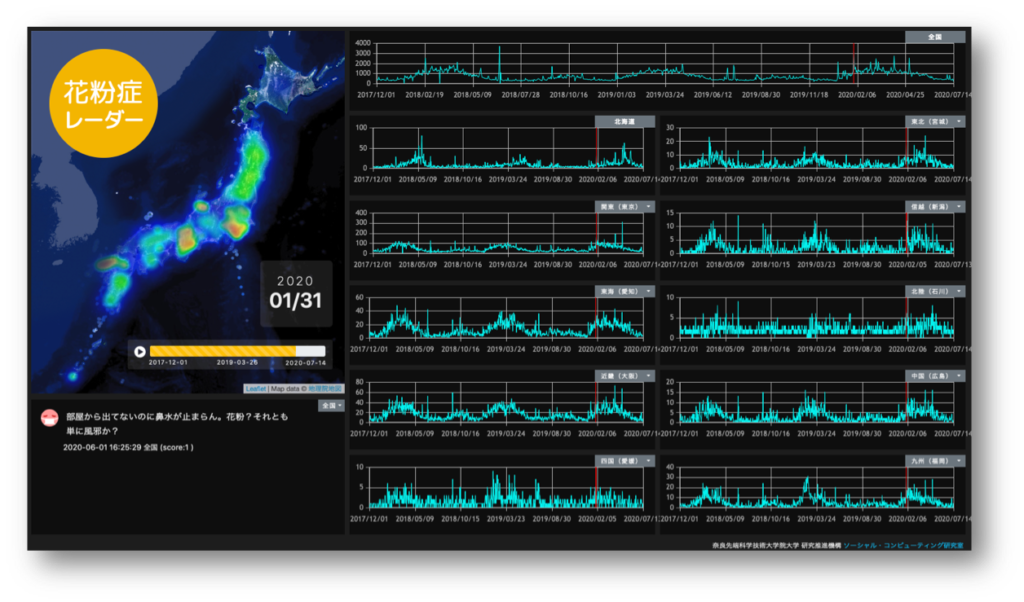
Overview
We collect tweets related to hay fever (pollinosis) or about hay fever from microblogging service Twitter on a daily basis. We present the number of such tweets by prefecture on a map of Japan on a daily basis. This map is representative of prevalence of hay fever in a given prefecture in a given day. We also provide a graph that shows the daily trends for the amount of tweets related to hay fever for all of Japan and also for all prefectures.
Technical Characteristics
Identifying Posted Location (Prefecture)
We identify the location based on either the GPS information added to the tweet when posted or the user’s location as displayed on their profile.
Extracting positive utterances by applying natural language processing technology
Using the natural language processing technology developed by our laboratory, we extract, collect and count only the comments of the users who were likely to actually have symptoms of hay fever among the comments mentioning hay fever.
Related System and Applications
Hay Fever Prediction Map based on Language Processing
This service is a based for our Kafun Radar application.
Eiji Aramaki, Mizuki Morita, Emiko Shinohara (Yamada) and Mizuki Oka: A large-scale and real-time method for extracting disease information from the web, The 17th Annual Conference of the Association for Natural Language Processing, 2011.
(荒牧英治, 森田瑞樹, 篠原(山田) 恵美子, 岡瑞起: ウェブからの疾病情報の大規模かつ即時的な抽出手法, 言語処理学会第17回年次大会, 2011.)
A smartphone application called Hay Fever Navi is made available. The data used for monitoring levels of hay fever is the same as that used in Kafun Radar. Please feel free to download the application from apple store [App Store] [Press Release]
